Cities globally face many environmental challenges and government organizations across the world are placing more and more emphasis on developing environmentally sustainable urban areas. Australia is often called a ‘coastal nation’, with the majority of its urban areas situated on or nearby coastlines, making them increasingly vulnerable to the negative effects of climate change. Increasing the community’s resilience to the ongoing effects of climate change has become one of the most critical considerations for strategic planning within government organizations. As such, developing methods that can be used to accurately and repeatedly measure environmental parameters across regional scales is a fundamental challenge for management experts – if assets are not accurately measured, they cannot be effectively managed.
‘Urban forests’ is a general term used to describe any trees within the urban environment. Urban trees have been identified as an extremely important tool that can be used by policymakers within state and local government organizations to mitigate numerous negative environmental effects associated with increased urbanization as well as increasing the community’s resilience to ongoing climate change. Scientific studies have shown that the presence of trees in urban areas has a wide range of positive economic, social and environmental effects. Specifically, urban trees can have positive effects on residents' health, well-being and safety, improve local air quality and storm water attenuation as well as combat the effects of climate change through carbon sequestration and reducing the magnitude of urban heat islands.
As the scientific community’s understanding of the importance of trees within urban environments has increased, so have the efforts of national and local governments to measure, assess and increase the number of trees and green spaces within their government areas. Australia is one of many countries to adopt nationwide initiatives to increase the amount of vegetation and green spaces in urban zones. An Australian study (Jacobs et al., 2014) showed that the national average for tree cover within 139 local government areas in 2013 was 39%, with capital city tree canopy coverages ranging from 27% in Adelaide to 59% in Hobart.
A detailed, accurate assessment of the extent and spatial distribution of tree canopy cover has become a critical tool for policymakers and management experts within state and local governments to assess the effectiveness of ongoing environmental management practices and to achieve regional environmental targets.
Listen to Fabrice Marre and Dr Samuel Holt from our R&D Team speak about urban forests and how our LiDAR services can help monitor and plan to grow them.
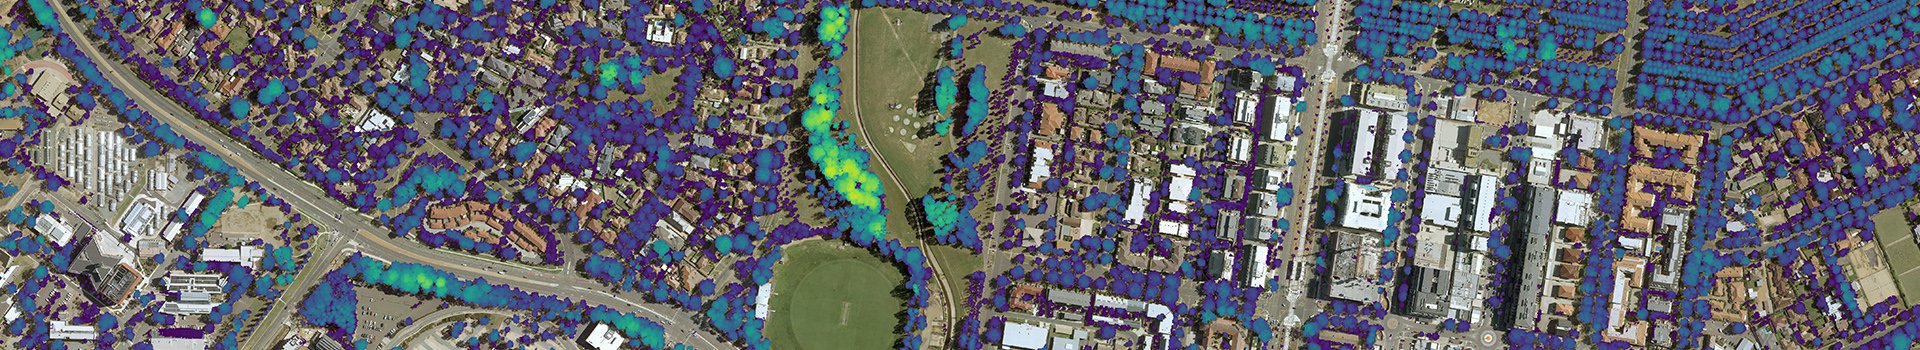
LiDAR, which stands for Light Detection and Ranging, is an active remote sensing method that is used to accurately measure the landscape in three dimensions. This is done by measuring the time taken for an emitted laser pulse (up to two million times per second) to travel from the sensor mounted in an aircraft, to the ground surface and for the pulse to be reflected back to the sensor. LIDAR technology directly images the landscape in 3D, meaning that the three-dimensional datasets produced are free of geometric distortions that can be present in conventional two-dimensional imagery.
When laser pulses emitted from a LIDAR sensor are incident on a tree, a portion of the energy is scattered or reflected back towards the sensor by the top of the tree canopy, and the remaining energy is transmitted through gaps in the foliage and interacts with lower branches, leaves or stems or even the ground surface below the tree. The unique way in which LIDAR pulses interact with vegetation make it possible to quantify vertically distributed forest and individual tree attributes and extend traditional two-dimensional environmental models into the third dimension.
Urban environments are particularly challenging to classify and map using remote sensing techniques as they are geometrically, texturally, and spectrally complex. Compared to other remote sensing methods for mapping vegetation (e.g. statistical approximations, supervised classifications and Machine Learning / AI based two-dimensional classifiers), LIDAR explicitly measures the location of trees in three dimensions and therefore has the potential to generate more accurate measurements of the proportion and spatial distribution of tree canopy coverage across urban landscapes. This survey technology, and the information derived from it, has become a critical asset for strategic environmental planning within local government organisations.
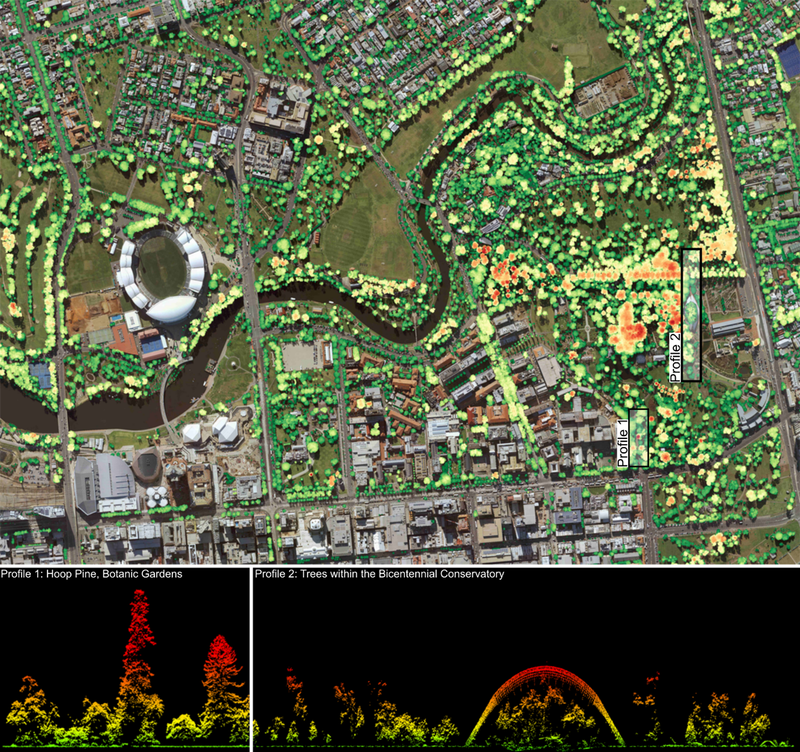
Figure 1. A Digital Canopy Model showing the tree canopy above 3m across northern Adelaide. Canopy is colour coded according to height above ground (green = low, red = high). Profile 1: shows the three-dimensional structure of the tallest tree in the Adelaide Botanic Gardens, an approx. 45 m tall Hoop Pine, derived directly from a LIDAR point cloud. Profile 2: A detailed three-dimensional model of the Bicentennial Conservatory, as well as the trees growing within it. Classified LIDAR point clouds allow users to easily isolate man-made structures, the ground surface and vegetation.
The ability to accurately quantify a wide range of fundamental vegetation parameters and the ease at which it can be combined with other quantitative datasets, such as aerial imagery, makes LIDAR an extremely powerful tool for mapping vegetation in both natural and urban environments. Numerous targeted vegetation metrics can be derived from LIDAR that provide management experts and policymakers with actionable information that can be used to help maintain and increase the tree assets in urban areas.
The extraction of features and specific tree attributes requires detailed point cloud classification and filtering and care must be taken during production stages to accurately classify and isolate the vegetation of interest from other man-made features, including buildings, infrastructure and other assets such as power lines. Aerometrex has developed a suite of vegetation metrics that can be accurately extracted from our industry-leading classified LIDAR datasets that are specifically tailored towards helping state and local governments manage tree canopy within their communities as well as achieve regional environmental goals. These include:
In combination, these vegetation metrics provide an unparalleled snapshot of tree canopy coverage across an area of interest, providing experts with highly accurate three-dimensional tree canopy attributes that cannot be as accurately derived from traditional two-dimensional aerial imagery.
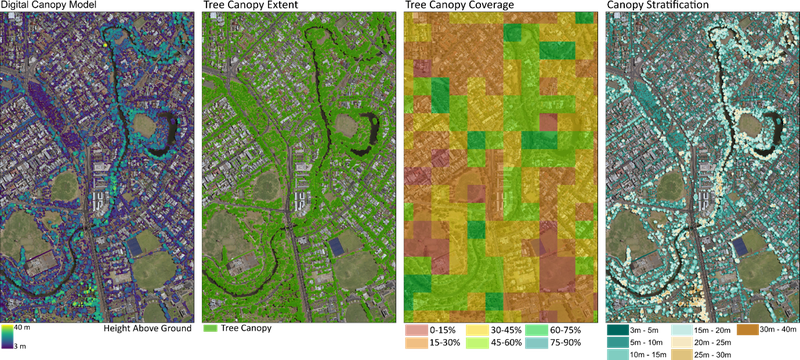
Figure 2. Vegetation analysis deliverables offered by Aerometrex. From left to right: Digital Canopy Model showing the height of tree canopy above ground. Tree Canopy Map showing the horizontal extent and precise area of tree canopy. Tree Canopy Coverage Map showing the precise proportion (%) of tree canopy coverage per 100 m by 100 m unit area. Canopy Stratification Map showing the horizontal extent of tree canopy within defined height intervals.
In 2020, in collaboration with the state government and sixteen local councils, Aerometrex has undertaken a regional tree canopy assessment of Metropolitan Adelaide providing state and local government representatives with a robust benchmark dataset that can assist in the management of Adelaide’s urban forests for years to come. Detailed vegetation analysis was carried out for all participating councils at a spatial resolution of 1m to provide a detailed summary of the amount of tree canopy coverage across Metropolitan Adelaide, its spatial distribution and what land use and land ownership types it predominantly covers.
The analysis shows that that 23.4% of metropolitan Adelaide is covered by tree canopy, with an average tree canopy coverage of 23.2% across participating councils. A comprehensive statistical breakdown of the types of land use and land ownership classes that tree canopy covers across the study area indicates that the greatest opportunity for local government areas to meet the 30-Year Plan for Greater Adelaide’s target of a 20% increase in urban green cover by 2045 is on private land.
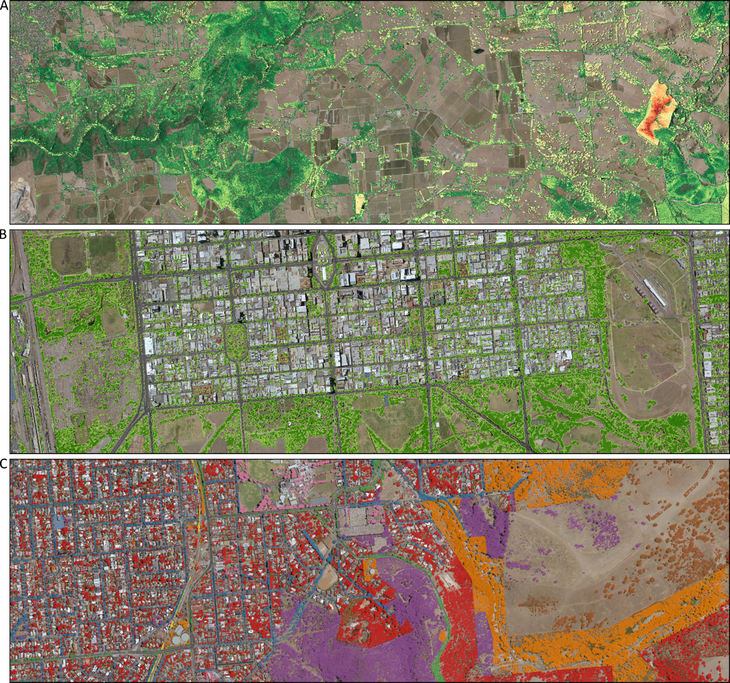
Figure 3. Examples from the Metro Adelaide tree canopy analysis undertaken by Aerometrex in collaboration with the state government and sixteen local councils. A: Digital Canopy Model from within the City of Onkapringa. The tall tree canopy highlighted in red is the highest tree canopy (above ground) in Metropolitan Adelaide at 48.3 m high within Bone Gully Forest. B: The horizontal extent of tree canopy across the southern portion of the Adelaide CBD and park lands. C: Classification of the tree canopy within the City of Mitcham according to what type of land ownership class in covers. For most councils within the study area, the majority of tree canopy covers privately owned land (red in this image).
The results of this study can be viewed online within the Department for Environment and Water Urban Heat and Tree Mapping viewer. These datasets provide management groups across multiple levels of government invaluable information that will help guide their tree management practices as well as provide a benchmark dataset to measure the change in tree canopy cover across Adelaide in the years to come.
View the full report from Aerometrex here.
The methods used to extract tree canopy attributes from LIDAR are accurate, cost-effective and repeatable. Vegetation metrics can be easily and simply compared across repeat LIDAR captures in order to develop an understanding of the degree to which tree canopy is increasing or decreasing across the urban landscape. Observations such as these are critical in order to assess the effectiveness of tree canopy management policies and will be critical in adapting current strategies to the dynamic challenges that will be faced by communities in the coming years.
Figure 4. (Below) Examples of the ways in which changes in the urban landscape can be monitored and measured using LIDAR derived datasets. The change in tree canopy height can be measured over time to give an understanding of how trees are growing, as well as where trees are being removed. Building construction and demolition can be measured and spatially linked to tree canopy losses. Detailed statistics can be generated that summarise the extent of tree canopy gain or loss, as well as where it is happening within the community, that can be used to guide management programs. These reported statistics are not representative of any given Local Government Area.
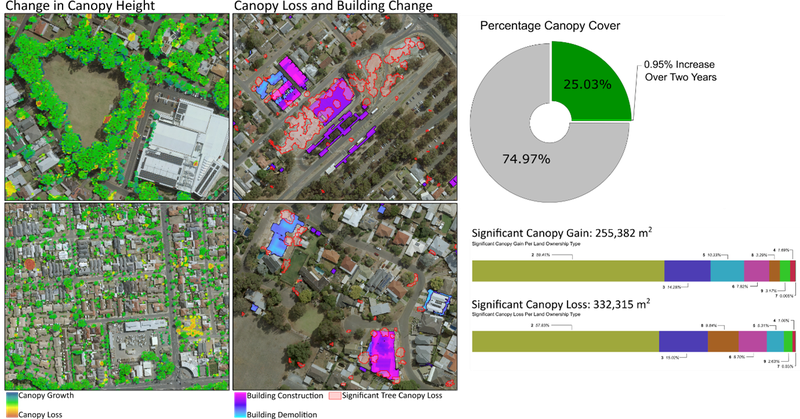
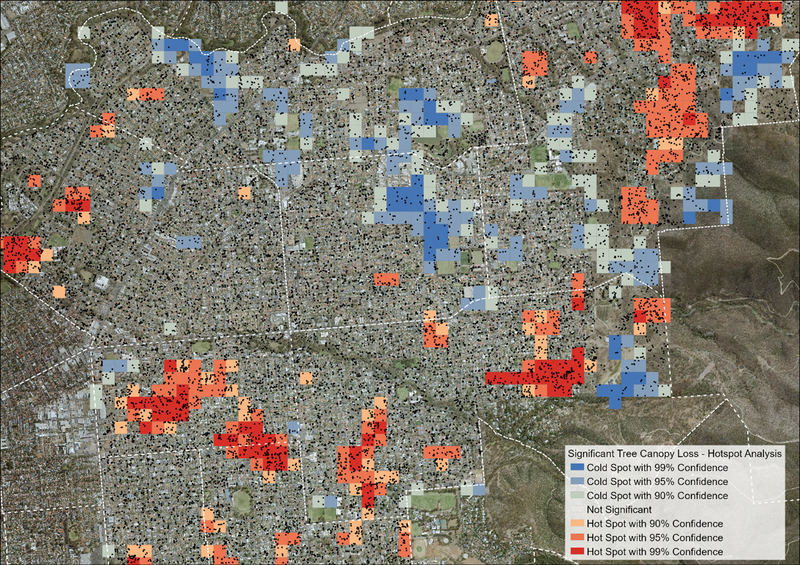
Figure 5. (Below) Hotspot analysis showing areas of intense tree canopy loss (red) and areas where there is below average tree canopy loss (blue) generated from repeat LIDAR captures across Metropolitan Adelaide. By combining geospatial analysis such as this with suburb boundaries, environmental management experts can gain a clear understanding of where in their LGA the most severe canopy losses are occurring. These results are not representative of any given Local Government Area.
LIDAR does not just image the urban forest, but it builds a detailed three-dimensional model of the entire urban environment. In addition to vegetation metrics, individual building attributes and accurate terrain models can be derived from classified LIDAR point clouds using simple, repeatable methodologies. As a result, LIDAR can provide end-users with a much wider range of deliverables
than information derived solely from two-dimensional imagery, all of which provide valuable information to a wide range of disciplines - ranging from vegetation analysis for environmental management, individual tree segmentation for asset management, accurate building footprints for urban planning to high accuracy digital terrain models for surface run-off and flood modelling.
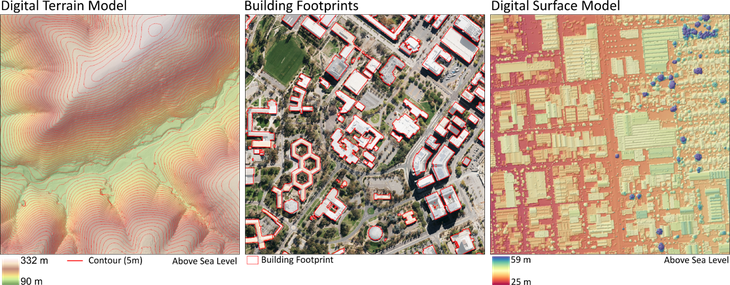
Figure 6. Examples of valuable information that can also be derived from LIDAR datasets that cannot be as simply derived from traditional two-dimensional imagery.
Dr. Samuel Holt, Research & Development, Aerometrex