How an Aerometrex aerial LiDAR survey moves from flight plan to classified point cloud, and what sets the accuracy of the data you receive.
A LiDAR scanner on an aircraft maps the shape of the land by firing laser pulses at the ground and timing each echo. Survey sensors such as Aerometrex's can fire up to 2 million pulses per second. Aerometrex then lines up the flight strips (the band of ground scanned on each pass) so their heights agree, and sorts every point into classes such as ground, trees and buildings, following national standards from the Intergovernmental Committee on Surveying and Mapping (ICSM).
| Aerial LiDAR from a plane | Drone LiDAR | |
|---|---|---|
| What area does it suit? | Suburbs, catchments and whole regions | Single sites and small areas |
| How are flight strips aligned? | Aligned and checked in processing, with the figure stated in the quote | Depends on the operator's processing |
| What density can it reach? | Set by flight height, speed and overlap to suit the job | Can be very dense, because it flies low |
| What stops a flight? | Cloud, fog, smoke and rain | Wind, rain and airspace limits |
If you are commissioning an aerial LiDAR survey, three factors govern the positional quality of the data: ground control, flight strip alignment and the positioning of the scanner relative to global navigation satellite system (GNSS) base stations. Ground control consists of points surveyed on the ground, which Aerometrex uses to test the finished survey and adjust its heights. Strip alignment makes overlapping flight strips agree on the position of the same surface, and Aerometrex aligns its strips to within 5 cm or better. Scanner positioning depends on the base stations used and their distance from the survey area, with one station within 20 km allowing Aerometrex to place the scanner to within 2 to 5 cm. Classification is a separate measure of quality, as a point assigned to the wrong class remains positionally correct, meaning the classification type determines what the data can be used for rather than how accurately each point is positioned.
Aerial LiDAR works by timing laser pulses fired from a scanner mounted under an aircraft. Each pulse bounces off the ground, or a roof or tree on the way, and the scanner records how long it took to come back. Light travels at a known speed, so that time gives the distance. Aerometrex's sensors fire up to 2 million pulses per second.
LiDAR stands for Light Detection and Ranging. According to the US ocean agency NOAA, its two main types use different light: topographic LiDAR maps the land with a near-infrared laser, while bathymetric LiDAR uses green light that passes into water. Aerometrex flies topographic LiDAR and does not offer bathymetric survey. A single pulse can also return more than once, bouncing back from a treetop, then if gaps in the canopy are present it can also reach a branch, then the ground. Each return becomes its own point, which is how LiDAR can measure the ground under trees, where photos cannot see it.
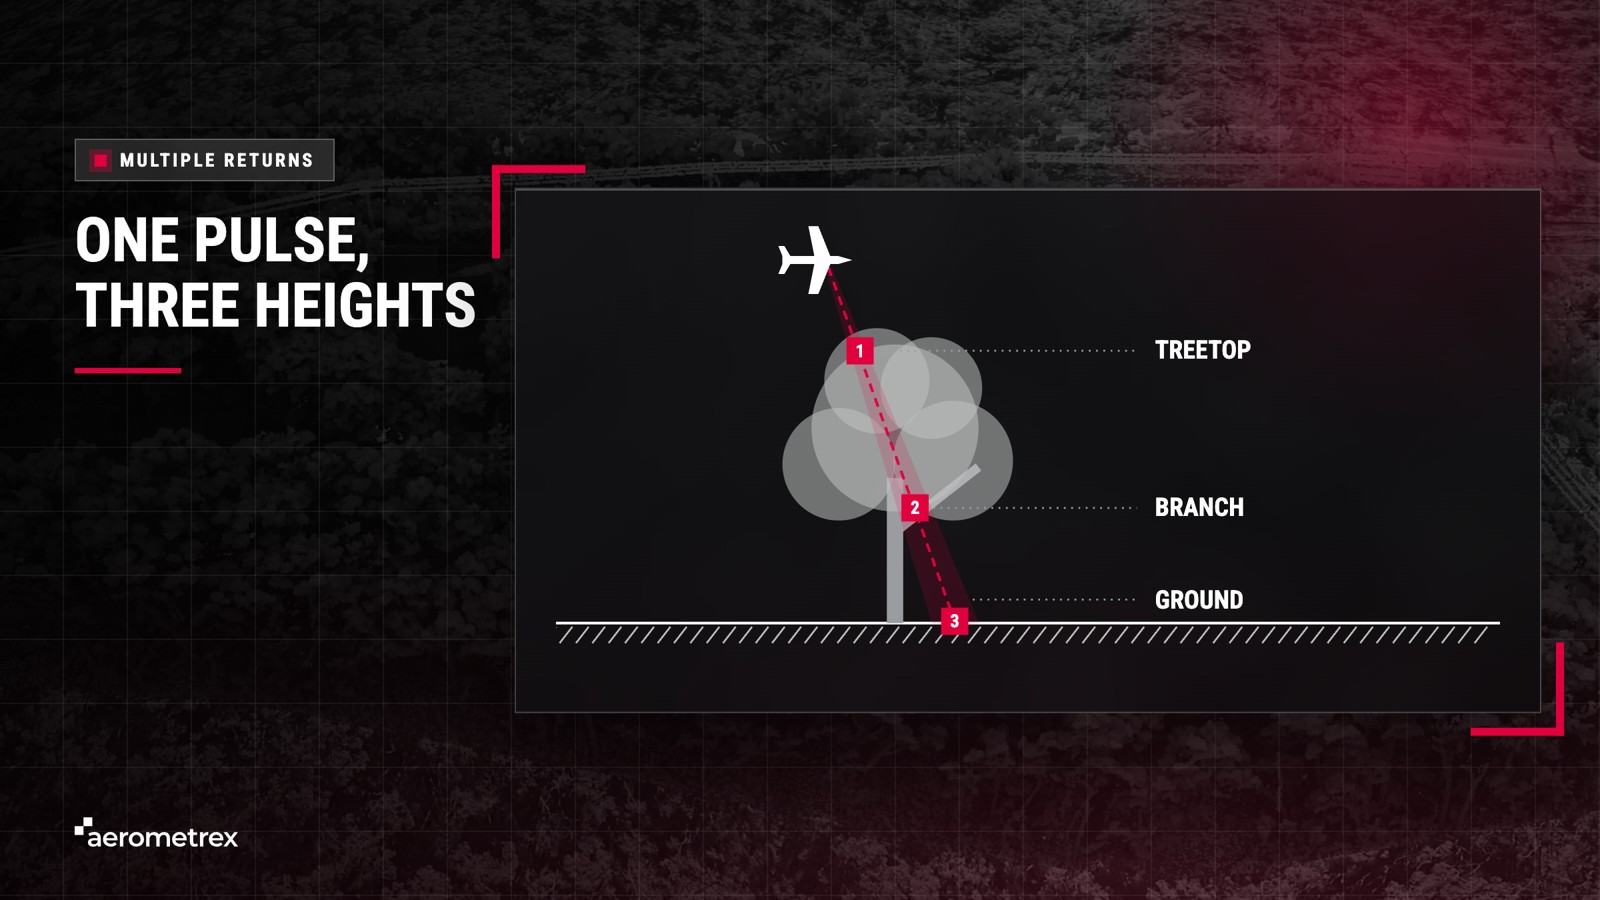
Millions of LiDAR points together form a point cloud: a 3D map made of dots, each with its own position and height.
Aerometrex surveys typically range from 1 to 50 points per square metre, and the job sets the density:
Choosing the density the job needs saves you paying for points you will not use. Aerometrex flies custom LiDAR surveys and also sells data it has already flown, and both options sit on Aerometrex's aerial LiDAR page alongside a coverage map of the existing data.
An aerial LiDAR system has three main parts carried on the aircraft: a laser scanner, a GNSS receiver that tracks the aircraft's position, and an inertial measurement unit (IMU) that tracks its tilt and heading. Aerometrex flies a RIEGL VQ-780 II-S scanner, which RIEGL rates to measure each distance to within 2 cm in its own tests at 250 m range; the finished survey is less exact, as the accuracy section below explains. A colour camera can also fly on the same aircraft.
Each of the three parts fixes one thing about every point, and the aircraft that carries them sets the coverage:
| Part | What it does | Why it matters |
|---|---|---|
| Laser scanner | Fires pulses and times each echo | Gives the distance to each point |
| GNSS receiver | Tracks the plane's position from satellites | Places each point on the map |
| IMU (motion sensor) | Records the tilt and turn of the plane | Tells which way each pulse was aimed |
| Aircraft (carries the system) | Flies the scanner, GNSS receiver and IMU along planned flight lines | Sets the coverage and the speed of capture |
GNSS positioning is more exact with a base station nearby: a fixed receiver at a known spot on the ground, used to correct errors in the satellite fix. Geoscience Australia runs networks of about 100 base stations across Australia and the South Pacific.
Positioning accuracy depends on the base stations used and how far away they are. With one station within 20 km, Aerometrex can place the scanner to within 2 to 5 cm, while several stations within 70 km give 2 to 10 cm.
Combining aerial imagery captured with LiDAR can colour the point cloud and help pick out road markings and low plants. Capturing both on one flight means the imagery and the point cloud show the site on the same day.
Aerial LiDAR data is captured in a planned flight, or several for a large area, then processed in 8 steps into a classified point cloud. Aerometrex plans, flies, processes and checks every survey in-house, with positional accuracy resting on the check against ground control and on strip alignment, which makes overlapping strips agree on height, while classification, which labels what each point hit, is checked as a separate step.
Before any processing, our flight planners set the flight lines, speed and overlap to meet the density the job needs, and the aircraft flies at heights from 500 to 3,100 m. ICSM's 2025 national LiDAR specification asks for at least 10% side overlap, meaning neighbouring strips share at least a tenth of their width, and that overlap is essential because strip alignment works by matching the shared ground.
After the flight, Aerometrex processes the LiDAR data in 8 steps, from download to delivery:
Strip alignment makes the separate flight strips agree on height. Each flight line scans a strip of ground, also called a swath, and neighbouring strips overlap. A cross line called a tie run is flown across many of them to tie them together. If the strips do not line up, a flat road can show a false step between two flight lines.
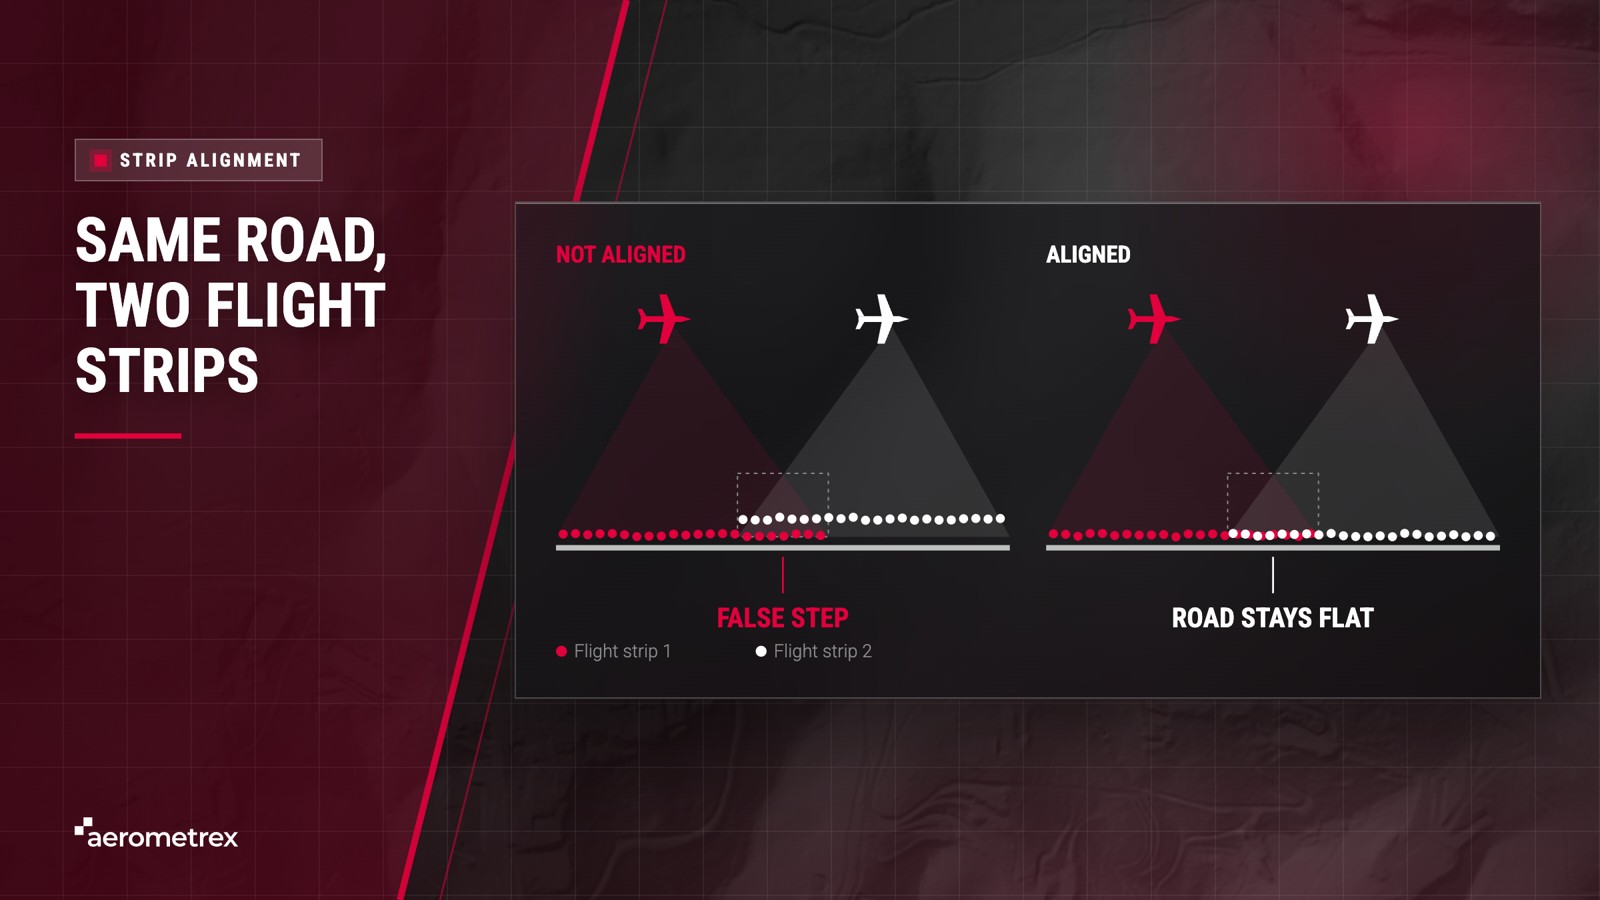
Aerometrex aligns the flight strips so overlapping strips agree to 5 cm or better, using an in-house method with RiProcess and BayesMap software and its own quality checks. This 5 cm figure describes strip alignment, meaning how closely overlapping strips match each other, rather than the overall accuracy of the survey, which is set out under the uses and limits of LiDAR mapping below.
The United States Geological Survey runs the same test on its own surveys: it checks how well strips agree where they overlap, and its specification accepts a height gap of 8 cm or less in areas of swath overlap.
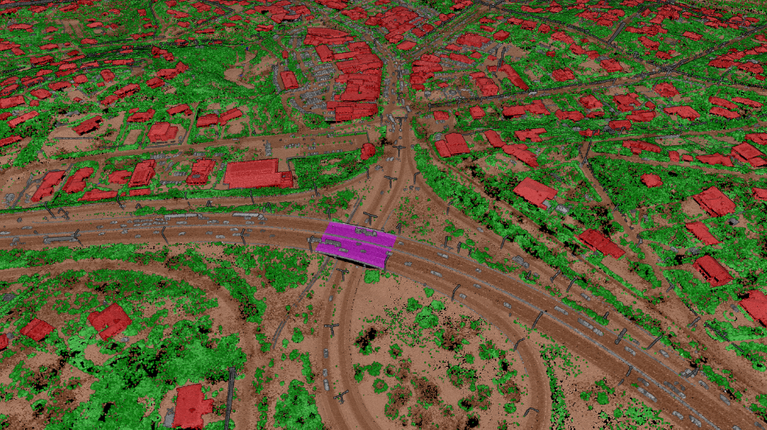
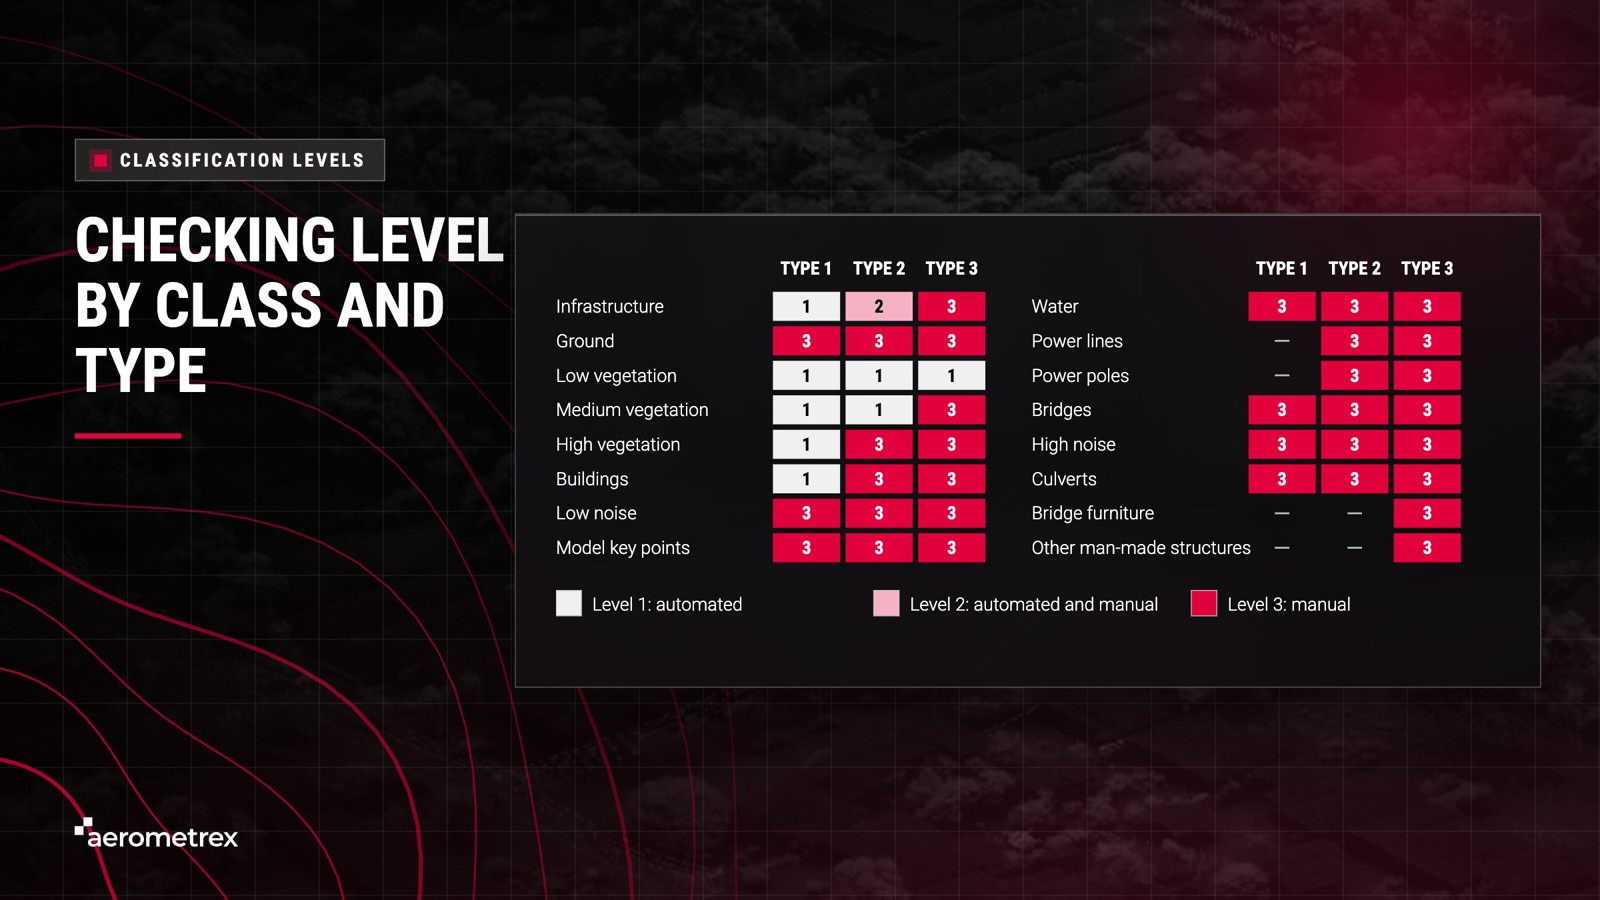
Aerometrex offers three classification types built on ICSM standards, each sorting the points into more detail than the last, from ground models (Type 1) to fine detail such as bridge furniture and other man-made structures (Type 3). Every classified point carries a class number from the national scheme, adapted from the LAS format (the standard LiDAR file format) of the American Society for Photogrammetry and Remote Sensing (ASPRS): 2 is ground, 3 to 5 are low, medium and high vegetation, 6 is buildings and 9 is water. Our guide to how LiDAR point clouds are classified sets out what each type includes.
| Type | What gets sorted and checked | Typical use |
|---|---|---|
| Type 1 | Ground, noise (stray points), water, bridges and culverts | Ground models, contours and flood work. A cost-effective option |
| Type 2 | Type 1, plus tall trees, buildings and infrastructure | Building heights, tree cover and planning |
| Type 3 | Type 2, plus bridge furniture and non-building man-made structures | Specialised projects |
The classification type decides which classes are labelled, while the level sets how much manual checking those labels receive. Levels follow the ICSM Australian Airborne LiDAR Acquisition Specification, Version 2.0.
Level 1: automated and semi-automated classification.
Level 2: surface improvement using automated and manual methods.
Level 3: manual correction with significant, highly supervised effort.
Aerometrex delivers aerial LiDAR data in anywhere from 24 hours to about 4 weeks, depending on whether the area has already been flown. Off-the-shelf LiDAR can be ready in as little as 24 hours, while a new capture can take about 4 weeks from flight to delivery, with weather, area size and classification type moving that timeline most.
Off-the-shelf data is fast because Aerometrex has already done the flying and processing, which makes the coverage map the first place to check: your area may already be flown.
A new LiDAR capture takes longer because each step has to run in order, and these factors move the delivery date:
Sharing your deadline at the start lets Aerometrex set the flight plan, classification type and outputs to meet it. Councils planning a yearly program can see how Aerometrex works with urban planning and local government teams.
LiDAR mapping is used wherever people need accurate ground and object heights: engineers design on it, councils plan with it and forestry teams measure trees with it. It has three limits: cloud, smoke and rain stop a flight, thick bush reduces the points that reach the ground, and every survey shows the land as it was on the day of the flight.
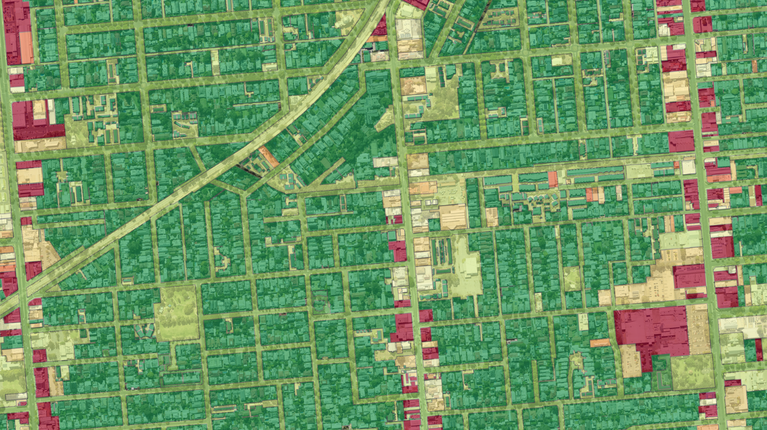
Engineers, councils, forestry and asset teams use LiDAR mapping for five main jobs:
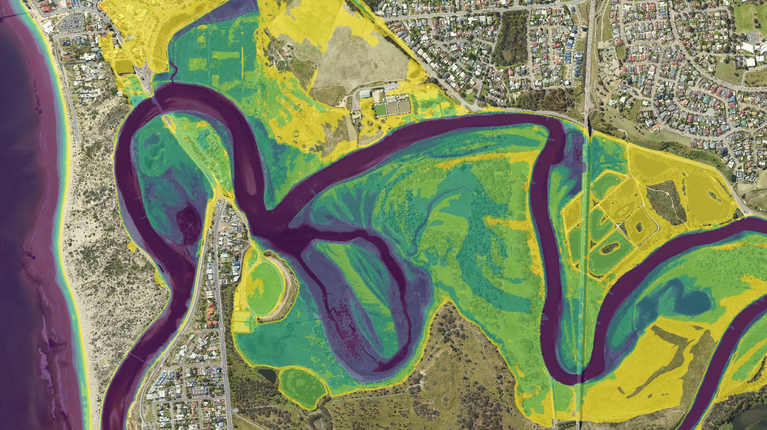
The national LiDAR specification requires capture without cloud, fog, smoke or rain. The same specification names dense vegetation as the greatest challenge for processing, and where no pulses reach the ground, the ground model fills the gap by estimating between points.
Straight from processing, before any adjustment to ground control, Aerometrex LiDAR can achieve a vertical (height) accuracy of plus or minus 20 cm at 68% confidence, meaning that at surveyed check points, about 68 in 100 checked points fall within 20 cm of the true height. When ground control is used, the figure is plus or minus 10 cm at 68% confidence, also called 1 sigma, meaning about 68 in 100 checked points fall within 10 cm. These are minimum accuracies, and the final vertical accuracy of a survey may be higher.

Aerometrex LiDAR delivers a horizontal accuracy (position on the map) of plus or minus 30 cm at 68% confidence, though actual specifications vary by project. Our guide on how accurate aerial LiDAR data is gives the full detail.
LiDAR measures distance with laser light, a bit like timing an echo. A LiDAR scanner fires pulses and times how long each one takes to bounce back, and millions of these measurements build a 3D map called a point cloud.
Aerial LiDAR can partly see through trees. Pulses pass through gaps in the leaves and some reach the ground, although in very thick bush fewer pulses get through, which leaves the ground with fewer points.
A classified point cloud is a point cloud where every point carries a label, such as ground, water, tree or building. That lets you build a ground model from the data, or measure only the trees or only the buildings.
Aerial LiDAR accuracy depends on the sensor, the satellite positioning (GNSS) signal, how well the strips line up and the ground control. Aerometrex delivers plus or minus 20 cm vertical at 68% confidence without ground control, or plus or minus 10 cm at 68% confidence with ground control (points surveyed on the ground). Figures from different suppliers only compare when each one states its confidence level and whether ground control was used.
Each flight line is captured on its own, so small errors can make neighbouring strips disagree. Strip alignment matches the ground the strips share where they overlap, so that heights agree across the whole survey.
Aerial LiDAR suits suburbs and regions, which a plane covers in a few flights, while a drone can suit one small site. Either way, the real test is how each option aligns its strips and checks its accuracy.